Adaptive Learning Products Gain Ground in K-12, Market Survey Finds
Districts’ spending on adaptive learning products has grown threefold between 2013 and 2016, according to a new analysis.
Sign up for Market Brief updates
To continue reading this story, please provide your email address. We will send you updates about new content that will interest you.
Schools’ spending on adaptive learning technology products topped $41 million in each of the last two years–and it has tripled since 2013, according to a new Noodle Markets report shared exclusively with EdWeek Market Brief.
For the purposes of the study, Noodle Markets defined adaptive learning products as interactive curricular resources that respond to student performance to “deliver appropriate teaching and scaffolding” to help students learn.
About 9 percent—or $11 million—of the spending in the adaptive learning category is on professional development, according to the report.
Larger, wealthier urban and suburban districts invest the most in adaptive products, the researchers found, but smaller and rural districts spend more of their total resources on adaptive products.
Investment in adaptive learning technology is likely to continue to grow, the researchers found.
This pattern identified in the study “resonates when we’re out in the market talking to people,” Robert Lytle, a managing director and a co-leader of the education practice at Parthenon-EY, Ernst & Young LLP, a business that provides consulting services to K-12 schools and the companies that sell to them. There is a strong demand for materials that claim to offer “adaptive” learning, and for resources to train K-12 officials on how to use them, Lytle said, as he predicted growth of this segment.
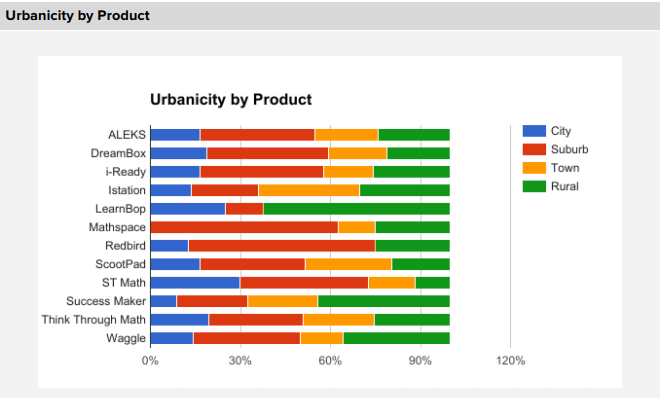
Besides looking at geographic and socioeconomic distribution of products, the report examines buying preferences across districts that purchased one or more of 12 products: ALEKS, DreamBox, i-Ready, Istation, LearnBop, Mathspace, Redbird, ScootPad, ST Math, Success Maker, Think Through Math, and Waggle.
The following chart breaks down usage of different, popular adaptive learning products by type of urban, suburban, and rural districts:
To arrive at its market share information, Noodle Markets analyzed about 20,000 line items from purchase orders obtained by SmartProcure, a company that aggregates this information from government agencies, including about 60 percent of schools and districts in the U.S.
While there are many other adaptive learning products on the market, these are the ones that were highlighted in the SmartProcure database for this purpose.
The Noodle Markets researchers found that districts in areas with lower median household incomes and higher poverty rates spend a larger share of instructional dollars on adaptive learning products.
“It’s shocking how different it is between lower-poverty and higher-income districts,” said Lytle, who noted that this reflects his experience working in the market.
Why are adaptive learning products in such demand in high-need districts? Lytle sees an appetite in those systems for a “fairly tight-looped system with embedded assessments,” that will help principals and chief academic officers meet specific student needs in ways they believe will produce academic gains.
This is the fourth Noodle Markets report that analyzes data from multiple sources to determine the market share of different products, and how they are adopted by districts of different sizes around the country. Previous reports have looked at middle school and K-3 math products, and English/language arts.
See also:
On adaptive learning:
- Adaptive Digital Curricula Lagging in Science, Social Studies
- 5 Trends to Watch in Adaptive Learning
- Why Developers of Adaptive Learning Products Are Missing the Mark
- What to Prioritize in Designing Adaptive Learning Products and Services for K-12
- What You Need to Know About Adaptive Testing of ELLs: A Researcher’s View
Other Noodle Market reports: