Tool Aims to Track Disparities in Ed-Tech Usage by Race, Poverty Level
Over the past year, as the pandemic has forced schools to abruptly pivot into remote and hybrid learning, educators have searched for ways to keep students on the other end of their computer screens engaged.
Now, a company that analyzes engagement with ed-tech products has released a tool designed to track disparities in student usage by race and income level.
LearnPlatform this month launched the National Edtech Equity Dashboard, which seeks to provide a publicly accessible view of daily ed-tech engagement by different student groups.
The usage data are based on analyses of districts serving 4 million students across 24 states, and their engagement with over 9,000 ed-tech products.
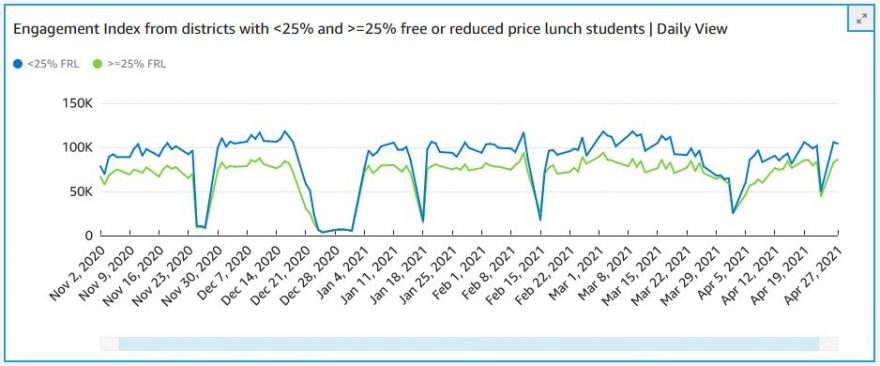
LearnPlatform data from earlier in the pandemic showed a wide gap in ed-tech engagement between districts with less than 25 percent of students on free- or reduced-price lunches and districts with more than 25 percent of students on free- and reduced-price lunch.
The organization reported about 75,000 daily interactions on ed-tech tools for every 1,000 students in relatively affluent districts between March and May of 2020, and about 25,000 daily interactions for every 1,000 students in less affluent school systems during that time frame.
LearnPlatform, based in Raleigh, North Carolina, works with school districts to give them data to research and choose ed-tech products, and evaluate their effectiveness based on engagement by students, teachers, and others.
The new equity dashboard breaks up the data into several categories, including a daily measure of ed-tech engagement across the U.S. based on student engagement with digital ed-tech sites; comparisons of student engagement between districts based on relative affluence; and, comparisons of student engagement between districts based on their percentage of Black/Hispanic student enrollment.
The dashboard shows that the gap between low-income and diverse districts and relatively affluent and majority white districts has generally narrowed over time.
As of late April, the digital learning equity gap between districts with greater than 25 percent of students qualifying for free or reduced-price lunch and districts with less than 25 percent of students qualifying for free or reduced-price lunch decreased by 24.1 percent compared to March.
A Gauge of the “Current Reality”
The data on students’ ed-tech engagement are derived from LearnPlatform’s EdTech Engagement Index, which is calculated based on the amount of web-based engagement per 1,000 users with any of the more than 9,000 ed-tech tools in use in U.S. school districts.
This index is based on web-based interaction with different tools, and doesn’t require students to log in: Page loads, minutes on system, and visible hidden windows are part of that interaction, said Karl Rectanus, co-founder and CEO of LearnPlatform.
The narrowing of the digital equity gap between March and April could be associated with recent efforts by many districts to increase their focus on trying to address disparities between students of different races and income levels, he said.
“We can point to some districts that have really highlighted their focus on equity and how they’re using this data to address the gap that they saw in the fall,” Rectanus said. Those K-12 systems are examining “what engagement looks like, the effectiveness of their instructional practices, and they have changed those practices in order to reach more students.”
Casey Rimmer, director of innovation and ed tech for the 41,500-student Union County Public Schools in North Carolina, said the dashboard is likely to make districts like hers re-examine whether ed tech is having equitable benefits among different populations of students. (Her district uses LearnPlatform to analyze its ed-tech usage.)
She said the measurements used in the dashboard will be part of Union County’s purchasing decision-making process, alongside considerations of teacher feedback, and statistics pertaining to correlation of students’ usage of ed tech and achievement scores, Rimmer said.
The dashboard will compel school systems to think, “‘This is something that our district needs to know more about, and we need to understand what our current reality is,’” Rimmer said.
The dashboard can shape policy and purchasing decisions at the state and local level, said Rectanus. Even though the equity data are nationally focused, the information provides framing for local and state leaders to look at their own data to discern how well their digital tools and platforms are serving underrepresented and economically disadvantaged populations, he said.
The dashboard also highlights that the disparity in digital education access for children across different demographics is “not just about what broadband speeds are available,” Rectanus said. “Actively measuring what [ed-tech] engagement looks like is a better indicator to close that digital divide.”
Separate data collected via ed-tech tools accessed monthly in the U.S. surged from 952 districts pre-pandemic to 1,397 districts in fall 2020.
These high usage levels will likely remain for the foreseeable future, as reopened schools will likely have to grapple with the reality of new COVID variants surfacing and the need to use remote and hybrid learning environments, Rectanus said.
“By any definition, [the level of ed-tech usage is] absolutely a boom,” he said. In many districts, the need to remain online, and the reliance on ed-tech tools, “is not going away.”
Follow EdWeek Market Brief on Twitter @EdMarketBrief or connect with us on LinkedIn.
See also: