A Tool for Comparing States’ Educational, and Economic, Performance
Elected officials, researchers, and policy wonks of all stripes have spent years theorizing about whether improving the performance of K-12 systems fuels job growth, and nurtures math- and science-related innovation and industry.
Now, a federal agency is promoting a data tool that officials believe will allow the public and policymakers to scrutinize those questions, and many others, with more depth and precision. The state data tool, as it is known, offers a customizable way of searching through reams of state and federal data, culled from sources such as the Census Bureau, the Bureau of Economic Analysis, and the National Assessment of Educational Progress, among many others.
There are 71 different data series that are used to produce 59 state-level economic and academic indicators included in the site, said Nirmala Kannankutty, a senior adviser at the National Science Foundation, a part of a team that worked on the site for the agency.
Among the state-level economic and academic indicators within the data tool: public school teacher salaries; the average undergraduate pricetag at public institutions as a portion of personal income; the number of bachelor’s degrees in the workforce; and the number of high-tech businesses as a percentage of all corporations.
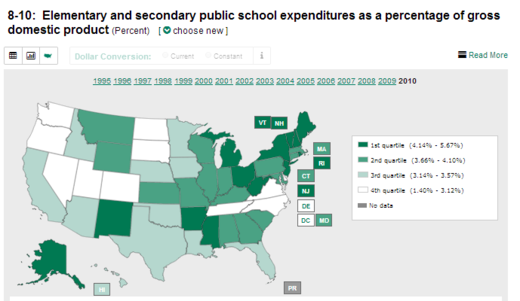
Visitors to the site can explore links between individual states’ student achievement, public school spending, graduation rates, economic growth, and employment in science- and engineering-related fields—and compare states’ performance in those areas against each other. (The embedded image is the result of a quick search of state-by-state spending as a percentage of gross domestic product.)
Other sites for crunching pools of educational data exist, but the NSF data tool provides targeted information for those interested in probing the intersection of educational, economic, research, and science and engineering trends, Kannankutty said.
The tool is meant to supplement the data in the 2014 Science and Engineering Indicators report, a document produced every two years that examines trends in those fields, which is published by the National Science Board. The board sets policy for the NSF.
NSF officials have been refining the data tool for years. An early version, which allowed visitors to call up data tables for short-term trends, was released in 2006, said Kannankutty. The current tool was unveiled in 2012 and updated this year. It provides users with visualizations and longer-term trend data.
In a statement describing how the tool works, NSF officials predict it will appeal to businesses and economic development officials keen on examining individual states’ economic potential, particularly for technology-focused businesses.
Information gleaned from the site is downloadable, and can be presented in tables, charts, and nationwide maps breaking down state results. Users can look at economic and educational trends overtime, and the sites allows for putting financial information from current dollars into constant dollars.
“We’ve put a different lens on the data, and we’re trying to be responsive to the community following these issues,” Kannankutty said. “We’re trying not to be prescriptive about [the data presented].”